What's Happening in Tucson Real Estate? September 2026 by the Numbers
Pima County closed 991 home sales in September 2026 at a $371,500 median. Days on market, supply, new builds, and the ZIP codes that sold most.
Prices held up and homes sold a little faster than a year ago. Inventory grew, about one in seven sales was a 2026-built home, and rates hit a level last seen in 2023.
The median Pima County home that closed in September 2026 sold for $371,500, up 3.1% from $360,500 a year earlier. By October 8, the 30-year mortgage rate on that home had climbed to 7.40%, and that pairing — firm prices, rising financing costs — is this month's story. September recorded 991 residential closings, 8.3% fewer than the 1,081 of September 2025. The median home went under contract in 36 days, three faster than a year earlier, and sold at 98% of its final list price. Under that steady surface, 438 sellers — 44% — had cut their price before closing, and active inventory kept building into October.
- 991
- Residential closings in Pima County, September 2026
- $371,500
- Median sale price, up 3.1% from September 2025
- ~$438,800
- Average sale price, lifted by 37 sales of $1 million or more
- 36 days
- Median days on market, down from 39 a year earlier
- 1,900 sq ft
- Average living area; the median home had 1,813
- 4.5 months
- Supply at September's sales pace, against 4,416 active listings
What Sold: Three Beds, Two Baths, and More New Builds
Detached single-family homes were 865 of the 991 sales, at a $384,900 median. Townhouses were 84 sales at $275,750 and condominiums 42 at $209,250. Three bedrooms led the mix with 424 sales, followed by 293 with four, 182 with two, 62 with five, 19 with one and 9 with six or more — an average of about 3.2 bedrooms. Two baths was the norm in 605 sales, three in 279, and the average came to about 2.4. The single most common home was exactly three bedrooms and two baths: 331 sales, a third of the month, at a $335,600 median on 1,558 square feet. It was also the fastest of the common layouts, at a 31-day median on market.
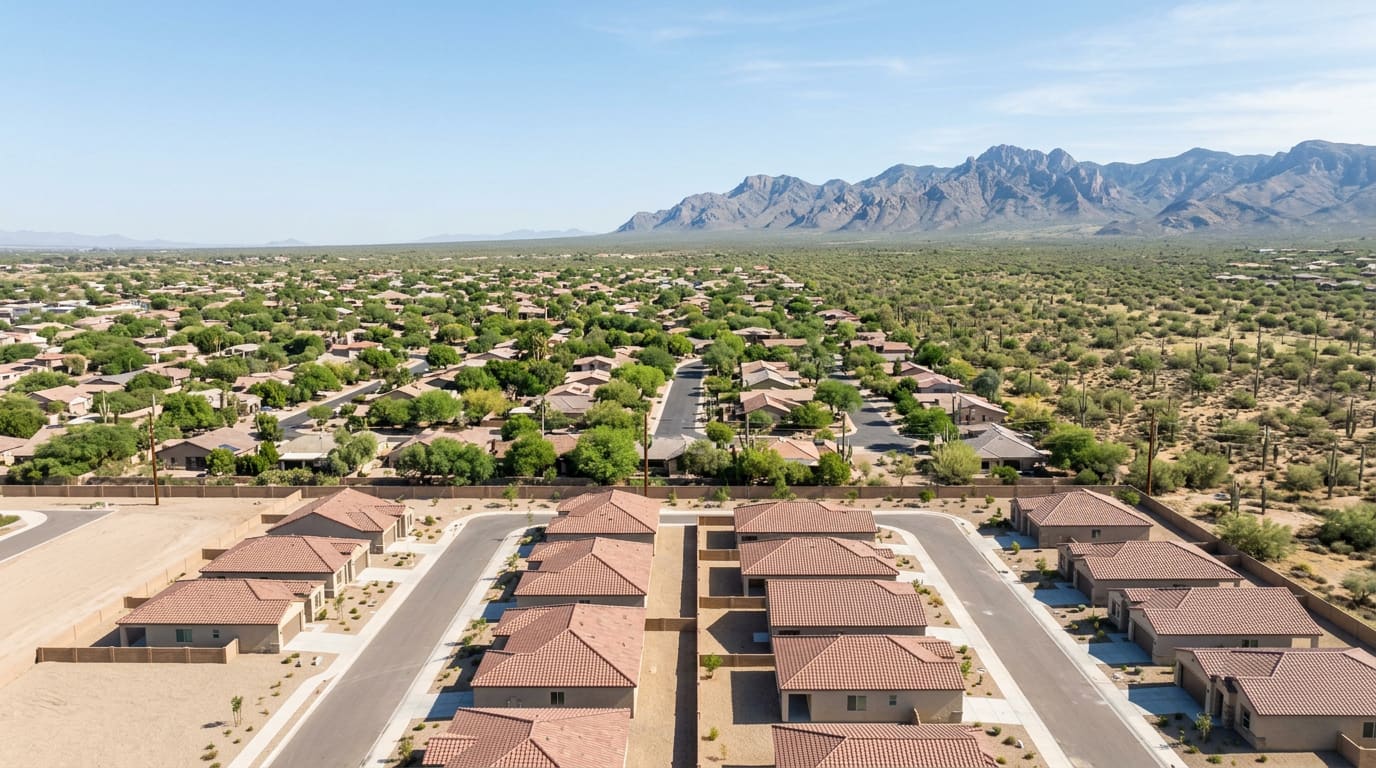
Resale homes still made up most of the market, but new construction was a real share of it. Of the 977 distinct homes in September's MLS closing records, 135 — about 14% — were built in 2026, and 158, or 16%, in 2025 or later. The 2026-built homes clustered in three ZIP codes: 28 in 85641 (Vail), 26 in 85629 (Sahuarita) and 20 in 85653 (Marana). That count only sees homes listed on the MLS; a builder that closes a sale directly, without a listing, is not in it, so the real new-construction share was likely higher.
Where It Sold: Vail, Green Valley and Marana Again
By ZIP code, the leaders were the same three edge areas as in August, with more sales each. The Vail ZIP, 85641, recorded 90 closings at a $422,500 median; Green Valley's 85614 had 85 at $326,990; and the Marana ZIP, 85653, had 63 at $400,000. Volume did not mean speed: 85641 took a median 51 days and 85653 took 54.5, and 52% and 56% of their sales had taken a price cut. Green Valley ran faster than the county at 33 days. The quickest ZIP codes with 25 or more sales were all on the northwest side — 85704 at 28 days, 85737 at 28.5, 85755 at 29 and 85743 at 29.5.
Among LiveBy's neighborhood boundaries in the county, nine had ten or more September sales. Rancho Vistoso in Oro Valley led on volume with 24 sales at a $555,325 median, and Continental Ranch in Marana was close behind with 23 at $357,000 and a 29-day median. The fastest of the nine was Quail Creek in Sahuarita: 14 sales at a $403,250 median in 18.5 days. The slowest were Gladden Farms in Marana, at a median 97 days, and New Tucson, at 95.
For Buyers: More to Choose From, Higher Rates to Pay
The 4,416 homes listed for sale on October 15 would take about 4.5 months to sell at September's pace, up from about 4.3 for August and inside the 4-to-6-month band usually read as balanced. Nearly half of those listings, 49%, have already cut their price at least once. The $300,000 to $500,000 band is still the tightest at 4.1 months; above $1 million it is 8.0. The catch is financing. The national 30-year fixed average rose every week from 6.71% on September 3 to that 7.40% on October 8, the highest weekly reading since November 2023 and up from 6.30% a year earlier. On September's median with 10% down, that moves principal and interest from about $2,070 a month at last October's rate to about $2,315 now, before taxes and insurance. A buyer with time can use the inventory; a buyer who needs a payment should get a rate quote before shopping.
For Sellers and Investors: Price It Like It Is Already October
A seller listing now is pricing for buyers whose payment has risen about $245 a month on the median home since last fall. September's 44% price-cut share says the first list price often missed, and at 4.5 months of supply the next buyer has alternatives. Pricing against recent closings of similar homes nearby, not against spring, avoids paying for that lesson later. Investors get the mirror image: more listings, more reductions and slower edge-area new builds give room to negotiate, but a 7.40% rate raises the bar any rental has to clear. Condos sold at 97% of list, the lowest ratio of the three types.
The Read for October
September 2026 was a balanced market getting more balanced. Prices rose modestly on the year and homes sold slightly faster, while supply climbed and almost half of sellers negotiated down. Early October closings are running about 17% below the same days of 2025, but those weeks are still being reported, so October's own count is the number to watch. The county snapshot is at www.kyleberglund.com/resources/market-stats.
How these figures were measured: every market number is an aggregate of MLS closings over LiveBy's Pima County boundary — not Tucson city limits — for residential sales (single-family homes, townhouses and condos) that closed September 1 to 30, 2026, pulled October 15, 2026. A closed month keeps changing for weeks as late reports arrive, so a re-run may differ slightly. Supply divides active listings on the pull date by September's closings. A ZIP code that crosses the county line is counted whole. New-construction shares come from the year built on each MLS closing record, de-duplicated by address. No individual sale, address or listing is reported here.
Sources
LiveBy (MLS data credited to MLS of Southern Arizona and Arizona Regional MLS) — closed-sale statistics, property type Residential, Pima County boundary 5afc4af02f86c27281e528b1, interval 2026-09-01/P1M — liveby.com — accessed October 15, 2026 (for the 991 closings; the $371,500 median and $438,824.04 average sale price; the 36-day median days on market; the 0.98 sale-to-list ratio; the 438 price-cut sales and 158 above asking; the 1,899.66-square-foot average and 1,813 median living area; and, by price band, 261 sales under $300,000, 494 between $300,000 and $500,000, 199 between $500,000 and $1 million, and 37 at $1 million or more). LiveBy — the same boundary and arguments for 2025-09-01/P1M and 2026-08-01/P1M — liveby.com — accessed October 15, 2026 (for 1,081 September 2025 closings at a $360,500 median and 39-day median days on market, and 1,014 August 2026 closings). LiveBy — the same boundary for 2026-10-01/2026-10-15 and 2025-10-01/2025-10-15 — liveby.com — accessed October 15, 2026 (for 316 and 380 closings). LiveBy — active-listing statistics, property type Residential, status Active, same boundary, with and without price segments at $300,000, $500,000 and $1,000,000 — liveby.com — accessed October 15, 2026 (for 4,416 active listings, 48.66% with a price reduction, and 1,139, 2,025, 956 and 295 listings by band). LiveBy — closed-sale statistics grouped by simple property type, same boundary, 2026-09-01/P1M — liveby.com — accessed October 15, 2026 (for 865 single-family sales at a $384,900 median, 84 townhouses at $275,750, and 42 condos at $209,250 with a 0.97 sale-to-list ratio). LiveBy — closed-sale statistics with single-value bedroom and bathroom filters, same boundary, 2026-09-01/P1M — liveby.com — accessed October 15, 2026 (for 19, 182, 424, 293, 62 and 9 sales with one, two, three, four, five and six or more bedrooms; 51, 605, 279, 46 and 10 sales with one, two, three, four and five or more baths; and 331 three-bedroom, two-bath sales at a $335,600 median, 1,558-square-foot median living area and 31-day median days on market). LiveBy — closed MLS listing records, property type Residential, same boundary, closed September 2026 — liveby.com — accessed October 15, 2026 (for 977 distinct single-family, townhouse and condo closings by address, 135 built in 2026 and 158 built in 2025 or later, and the 2026-built counts by ZIP code; analysed in aggregate only). LiveBy — closed-sale statistics grouped by boundary across the postal-code boundaries intersecting the county, 2026-09-01/P1M — liveby.com — accessed October 15, 2026 (for 85641, 85614, 85653, 85704, 85737, 85743 and 85755). LiveBy — closed-sale statistics grouped by boundary across the 662 neighborhood-layer boundaries intersecting the county, 2026-09-01/P1M — liveby.com — accessed October 15, 2026 (for the nine neighborhoods with ten or more sales, including Rancho Vistoso, Continental Ranch, Quail Creek, Gladden Farms and New Tucson). Freddie Mac — "Primary Mortgage Market Survey" weekly history — freddiemac.com/pmms/docs/PMMS_history.csv — accessed October 15, 2026 (for 30-year fixed averages of 6.71% on September 3, 2026, 7.40% on October 8, 2026, 6.30% on October 9, 2025, and 7.44% on November 16, 2023 as the last reading at or above 7.40%). Payment figures are standard 30-year amortization on 10% down on $371,500. All figures are current as of October 15, 2026. This post is for informational purposes only and is not an offer to sell or a solicitation of an offer to purchase real estate. Kyle Berglund and Tierra Antigua Realty fully support and comply with the Fair Housing Act and the Equal Opportunity Act.
Earlier coverage
- What's Happening in Tucson Real Estate? August 2026 by the Numbers — September 29, 2026
Topics
- Tucson Real Estate Market
- Market Update
- Pima County
- Home Prices
- Mortgage Rates
- New Construction
- Vail
- Green Valley
- Marana
- Rancho Vistoso
- Continental Ranch